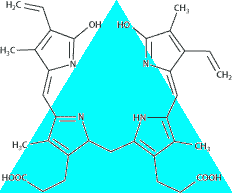
 The bililite.com Bilirubin Graph
Plots the bilirubin as a function of age, for use with the AAP Clinical Practice Guideline, Management of Hyperbilirubinemia in the Newborn Infant 35 or More Weeks of Gestation. Please contact me with any comments, suggestions, or questions.
This page uses HTML5, which in some browsers can mess up printing pretty badly (and Internet Explorer handles poorly in any case. Use compatibility mode for Internet Explorer 8). You may want to use the non-interactive version of this page or the PDF-generating version.